Color Commentary – How to Read and Interpret a Color Quality Test Report
Color Commentary
(How to Read and Interpret a Color Quality Test Report)
 There’s a good chance that if you’re reading this article, you are already familiar with the quantities that a color quality test report provides. Typical metrics include energy efficiency metrics, color point metrics, color rendering metrics, and spectral content information. These metrics are often required by specifications and regulatory bodies, but they can also be a very useful tool when selecting light sources. The secret is knowing how to read the reports. Below are some tips on how to quickly read a color quality test report and glean the most important information from its graphs and tables.
Energy Efficiency Metrics
(Visible “bang” for your electrical “buck”)
The front page of the test report gives a summary of some of the most common metrics for the evaluation of a light source. The electrical measurements (Voltage, Current, Power, Frequency, Power Factor, and Current THD) can help you evaluate the way that the light source consumes power when it reaches a stable operating condition under laboratory conditions. Most people are familiar with the concept of electrical power (W) consumed, but the Power Factor and Current THD can also be very helpful when evaluating the electrical performance of a light source. Power factor can range from 0 to 1, and many specifications require a value greater than 0.9. In general, the higher the power factor, the less current is required for the same amount of power. Current Total Harmonic Distortion (THDi) can indicate how much electrical “noise” the light source introduces to the electrical supply. It is expressed as a percentage of the current consumed at the fundamental frequency (typically 60Hz in the US). A pure sine wave would have a THD of 0%, and the number increases as the current waveform becomes more distorted. The energy efficiency of a light source is often evaluated using the luminous efficacy. The luminous efficacy is calculated by dividing the total lumens of the light source (Lm) by the electrical power consumed by the light source (W). The luminous efficacy is therefore expressed as Lumens per Watt (Lm/W).
Color Point Metrics
(The color appearance of the light)
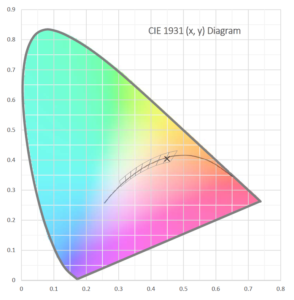
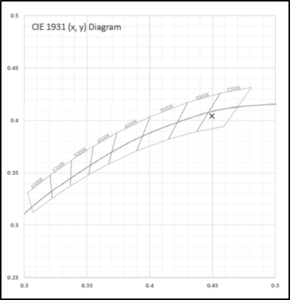
The range of all colors that the human eye can see can be shown on a two-dimensional plot. Once this plot (colorspace) has been defined, the total (integrated) color of the light from the test subject can then be shown as a point on the plot. The coordinates of this point are shown on the test report as chromaticity coordinates. The chromaticity  coordinates are shown as x and y for the CIE 1931 colorspace, and as u’ and v’ for the more color-uniform CIE 1976 colorspace. Within these colorspaces, you will see a line that starts in the red and moves through a bluish-white color. This line is called the blackbody curve, and it represents the range of colors that a blackbody radiator would emit as it is heated through its range of incandescence. The CCT (expressed in Kelvin) is the Correlated Color Temperature of the test subject, and it indicates how far along the blackbody curve (from deep red to bluish-white) the color of the test subject would appear. The Duv is a measurement that indicates how close the test subject’s color is to the blackbody curve. The Duv can be positive if the chromaticity point is above the blackbody curve (a generally more greenish color), or negative if the chromaticity point is below the blackbody curve (a generally more pinkish color).
Color Rendition Metrics
(A way to evaluate the colors within the light)
Although the human eye can very good at discriminating between colors, it does not fare particularly well when attempting to detect the individual spectral content of a light source. As a result, two light sources that appear to be very similar in color could render color in very different ways. For example, a colorful painting could appear very different when illuminated by an incandescent lamp than it might when illuminated by a compact fluorescent lamp with a similar CCT. The metrics used for evaluating color quality usually evaluate the appearance of several carefully chosen color targets when illuminated by the test subject as compared to the same color target when illuminated by a reference light source. The Color Rendering Index (CRI) is the average of the values for eight targets (R1,…,R8) and therefore is sometimes designated as Ra. Values closer to 100 indicate a closer match to the reference illuminant for that particular target color. Some specifications have criteria for R9 in addition to Ra since R9 is a strong red  color, and can help to indicate how well the test subject is providing light in the red end of the spectrum. TM-30 is a document published by the Illuminating Engineering Society to improve the metrics used by the lighting industry for evaluating a light source’s ability to render color. Where CRI uses the average of eight color targets to establish Ra, TM-30 uses 99 color targets to arrive at two numerical values, Rf and Rg. Rf is the fidelity index and is the most similar to CRI’s Ra. It has a maximum value of 100 indicating no relative color difference. Rg is the gamut index and it is the average of sixteen specific color areas (gamuts). A value is calculated for each gamut area based on the relative saturation or desaturation of the targets contained within each gamut. A value below 100 indicates desaturation, and a value above 100 indicates saturation.
Spectral Content
(The shape of color)
The Spectral Power Distribution (SPD) of a light source is the raw information about how much radiant power is emitted on a wavelength-by-wavelength basis. The spectral power distribution summary is a tabular version of the data, and the SPD plot is a graphical representation typically across the visible portion of the spectrum. Different types of light source technologies exhibit characteristic shapes in their SPD plots. Incandescent lamps have a continuous curve that starts very low on the blue (left) side of the plot and climbs steadily into the deep red and infrared portion of the plot. Fluorescent and HID sources typically have a “spiky” shape across the visible spectrum. White LED sources usually have a single narrow peak in the blue end of the spectrum, then a much broader peak in the amber region of the visible spectrum.

Afterthoughts
There is a lot of information contained in a typical color quality test report. In order to get the most out of your report, it helps to understand the broader categories of information contained within (energy efficiency metrics, color point metrics, color rendering metrics, and spectral content information). With this information, you can evaluate whether a proposed light source is likely to accomplish the task that you need it to perform in an installation.
Contact us for more information or to order testing.
