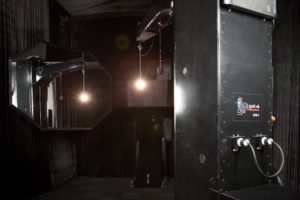
LM-79 Intensity Measurements
LM-79 Intensity measurements are measurements of luminous intensity (candela) from many different angular directions around an LED Light source. This set of candela measurements can be used to predict illuminance within an application or integrated to calculate zonal lumens or total lumens.
LM-79 measurements are primarily used for the measurement of light according to its perception by the human eye (a process called photometry or photometric measurement). The standard defines the test equipment, methods, and conditions that are needed to make accurate and reproducible measurements of the light output and electrical power consumed by LED products. The testing methods generally break down into two methods, angularly scanned and integrated measurements (goniometer measurements), and integrating sphere measurements. The first version of this standard was LM-79-08 and it was published in 2008. In 2019 a new version of the standard was published as LM-79-19. This version included tighter constraints on the laboratory conditions during testing with a goal of tightening the reproducibility and laboratory-to-laboratory agreement within the industry. LightLab International Allentown, LLC is fully capable of testing to both LM-79-2008 and LM-79-2019. For additional information on the new LM-79-19 requirements, click here.
IES LM-79 is a standard for the optical and electrical measurement of LED luminaires, lamps, and light engines.
LM-79 includes the measurement of light output using a goniophotometer (a process called goniophotometry). A goniophotometer is a test instrument that measures  luminous intensity (candela or cd) in a full set of angles around the light source. The job of the goniophotometer is to isolate the light produced in individual angular directions without measuring light produced in all other directions. The remainder of the light produced by the luminaire must be excluded (usually by using carefully positioned baffles and light absorbing materials). The set of candela values measured by the goniophotometer is called the candela distribution or intensity distribution of the light source. You can think of it as a sphere of light measurements looking back at the test subject.

Candela plots show “slices” of the candela values on a polar plot and are a standard part of a typical goniophotometric test report. The candela measurements are also compiled into IES files which can be used in many types of lighting application software to predict illuminance (footcandle or lux) levels when the luminaire is installed. The sphere of candela measurements can be integrated into a table of zonal lumens or the total lumen output (lm) of the test subject. The total lumens produced divided by the input electrical power consumed is called the luminous efficacy (lm/W). Other metrics that are calculated from the cd measurements include beam angle or beam spread, field angle or field spread, cone of light or circle of light, and coefficients of utilization tables or CU tables.
